|
The
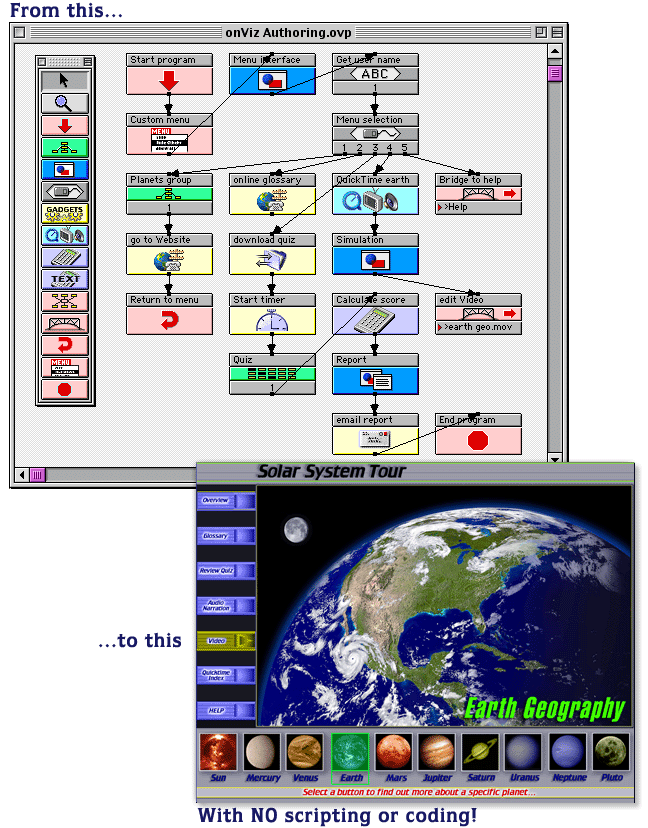
same visual "flow chart" metaphor is used in both
onViz and CourseBuilder. Construct your program
by dragging tools from the tool palette onto the Application
Map. Each tool has a unique function such as: presenting
information, collecting answers from your user, playing
digital sound or video, e-mailing report data, launching
another document or application, and calculating numbers,
to name a few. You have complete control over the content
and direction your application takes by simply dragging
routes from one to to the next.
For a complete description of the tools and features in onViz, click here to download the Feature List (in Adobe Acrobat format).

| click
here to go back |
|